

The Function Analyzer allows learners to see the connections among three representations of a function: symbolic, area, and graphic. In addition, by allowing learners to change the value of four elements of a function — the coefficient of x, the value of the independent variable, the constant (y-intercept), and the value of the dependent variable — the Function Analyzer becomes a tool for solving for x and evaluating for y.
The Function Analyzer helps to highlight:
Click to open the Function Analyzer.
The Function Analyzer opens, as below, with a single function displayed: y = 1x + 0. You can change that function as desired, add new ones, delete any you don't want, and hide or reveal function lines. You can also see three different representations of the function:
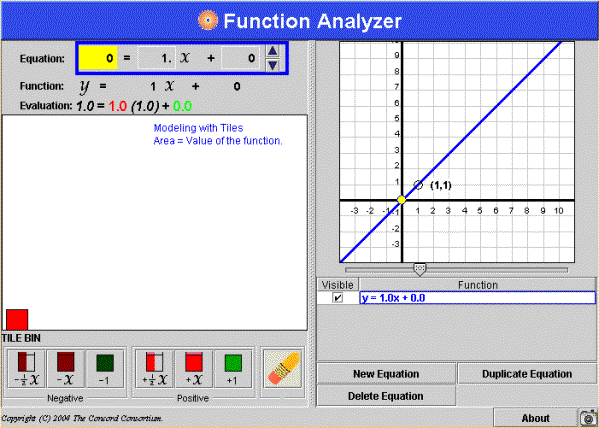
There are two ways to modify the equation using the Function Analyzer: symbolically and with the virtual manipulatives of the area model.
You can change the value of any of the following components by clicking on the component in the Equation box and using the ![]() arrows:
arrows:
You can change the value of the coefficient of x (slope) and/or the constant (y-intercept) using the area model via the buttons in the Tile Bin.
To change the area representing the coefficient of x use the appropriate button in the tile bin:

To change the area representing the constant use the appropriate button in the tile bin:

To delete elements of the area model:
1. Click the Eraser button in the tile bin.

2. Click any component to delete it.
3. Click the Eraser button again to toggle off the delete function.
To edit or view the symbolic or area model representation of a function:
The row for the selected function highlights in the function table and the line appears thicker on the graph.
To simultaneously change the value of x for all functions:
For each line visible in the screen for that value of x, a small circle moves along the line to mark the value of x.
![]()
The area model and symbolic representation in the "Evaluation" section changes to reflect the value of x.
To use the Function Analyzer to solve a selected equation, you must set the value for which to solve:

As you modify the value in the symbolic representation of the equation, that value is dynamically reflected in the graph.
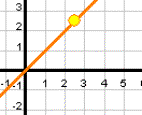
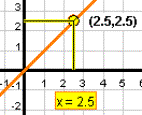
To demonstrate the solution of an equation using the Function Analyzer, change the value of x until the value of the function equals the desired solution. The Function Analyzer provides visual feedback when the value of x solves the equation:
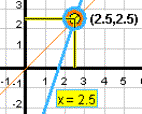
When the value of x solves more than one equation, the visual feedback will be slightly different:
You can temporarily hide or reveal function lines on the graph, by clicking the checkboxes in the Visible column in the function table.
To add a new equation to the Function Analyzer:
A new function with default characteristics (y = 1x + 0) is displayed in graphical and symbolic representations, and added to the function table.
A new equation with a default solution of 0 is displayed in the equation box.
The new function is automatically selected.
To remove a function or line from the Function Analyzer:
To remove all functions from the Function Analyzer click Delete All.
To duplicate a selected function:
A new function, identical to the selected function, is added to the function table. A new line is drawn over the selected line on the graph.
To save a picture of your session with the Function Analyzer that you can later post to the Discussion Board:
1. Click the ![]() button (found at the lower right of the Function Analyzer window).
button (found at the lower right of the Function Analyzer window).
2. In the Save screenshot as Image dialog box:
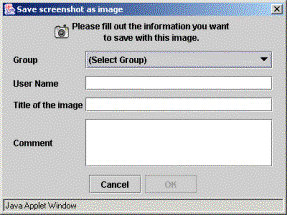
3. A dialog box will appear that displays the URL of your saved image.
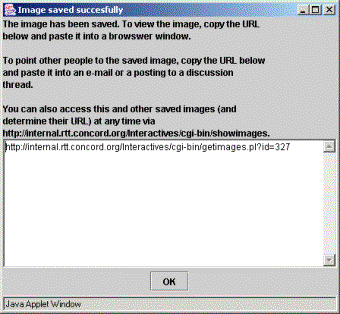
4. Copy and paste this address into your web browser to view your image. (Note that your address will be different from this example.)
5. Write down the URL for future reference (although you can always retrieve it by browsing all saved images—see Technical Help for instructions).
6. When you are finished, Click OK to close the dialog box.
Note To save a copy of your image to your own computer (for example, to have available even when you are not on the Internet), first view the image in a web browser, then right-click on a PC or control-click on a Mac and choose "Save Picture As…." Save the image with a name that you can remember. (Don't use the default "getimage.gif" name as you may over-write previously saved images.) If you would like to share your image in the discussion boards, follow the directions under Technical Help, How to Share an Image from an Interactive.
As you move lines around, you might encounter a few situations where you have to think outside the box, so to speak.
To return a solution to the viewable area of the graph:
To return a line to the viewable area: