
Transformations of linear functions, with links between the symbolic and graphic forms, can be powerful tools to help students overcome conceptual hurdles in algebra. The Linear Transformer supports a deeper understanding of a variety of concepts, including:
The Transformer lets you compare several functions and the slopes and y-intercepts of each. You can use a built-in tool to capture a screen shot of your work for reference and discussion.
The information presented here is designed to familiarize you with all the functionality of the Transformer.
Changing a Function (using the symbolic representation)
Changing a Function (using the graphical representation)
Making a Function Visible on the Graph
Transformations Along the Y-or X-Axis (Reflection)
Using the Slider Bar and Motion (or Model) Object
The illustration below shows the interface and names of the different areas.
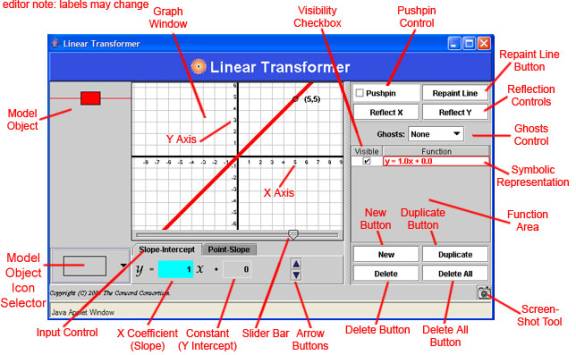
Linear Transformer Areas
Each of these areas will be explained in this guide. To use this guide, it helps to have the Linear Transformer open. This will make the concepts clearer and allow you to experiment.
Click to open the Linear Transformer
When the tool first opens, you see a single function, graphically represented by a red line. The function has a y-intercept at 0 and a slope of 1.0. On the right you see its symbolic representation: y= 1.0x + 0.0.
If you click and drag the line, the symbolic representation changes right along with it. If you change the numbers, the line moves accordingly.
To change the function numbers, use the controls at the bottom of the Linear Transformer window.
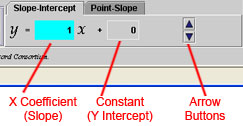
Illustration of Input Control
Note You can change the numbers in either the Point-Slope or Slope-Intercept forms. Click the tabs to choose the form. However, you will not see a symbolic representation of the Point-Slope form in the Function Area. It will continue to show the Slope-Intercept form.
You can move entire line in the Graph Window. As you move it, its slope remains constant while its intercept changes.
Click anywhere on a line and drag to change the y-intercept.
Note You can modify the slope using only the symbolic representation or the Pushpin Control.
The Pushpin lets you change the y-intercept and slope of a function using the graphic representation.
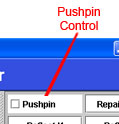
The Pushpin Control
To use the Pushpin:
To change just the slope, while the intersect remains constant, move the pivot point to the y‑intercept (0.0). (You may wish to switch to the Point‑Slope representation to see the Y point change.) You can then rotate the line, changing its slope without changing the y‑intercept.
When you first opened the tool, only one function was visible. But you can add as many functions to the Transformer as you wish.
To create a new function, click the New button below the Function Area. A new function appears, in two representations:
The new function has a new color.
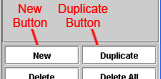
The New and Duplicate Buttons
Note To create a function that is an exact copy of an existing function, click the Duplicate button. The new graphical representation appears in the same position as the existing one (making it seem as if the original has disappeared). If you move the visible line (or change its symbolic representation) so the function is no longer identical to the original, you will be able to see the original also.
Beside the symbolic representation of each function is a Visibility Checkbox. Whenever you add a new function, the box appears checked and the function is visible.
To temporarily hide the graphical representation of a function, click the Visibility Checkbox. To make it reappear, click the Visibility Checkbox again.

The Visibility Checkbox
If an identical function is hidden "behind" another function in the Graph Window, clicking the Visibility Checkbox makes the hidden function appear (it will look as if the line changed color).
To delete a function, select its graphic or symbolic representation, and click the Delete button. To delete all functions at once, click the Delete All button.
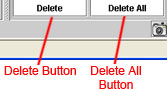
The Delete and Delete All Buttons
You can make a line invisible and then "repaint" it with the slider. To do this:
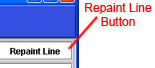
The Repaint Line Button
An important part of learning to work with functions is being able to recognize links between the graphic and symbolic representations, such as how changes to the slope or intercept appear in each representation.
A way to examine these differences is to use the Reflection controls. There are two controls, one to reflect the x‑axis and one to reflect the y‑axis.
![]()
Illustration of Reflection Controls
To use the reflection controls:
Sometimes it is helpful to see the new position of a line as well as its original position, for example, to observe reflections, parallel positions, or intersecting lines. To do this, use the Ghosts pull-down menu (to the right of the Graph Window):
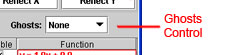
The Ghosts Control
Choose among three options: None, 2 Seconds, and Persistent:
The Screenshot button lets you save an image of your graph and its functions. To do this:
1. Click the Screenshot button (a picture of a camera in the lower right corner).
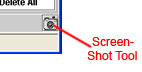
The Screenshot button
A dialog box opens that looks like the following:
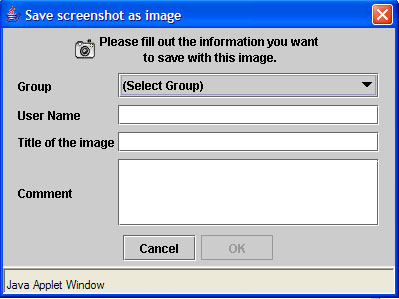
The Screenshot Dialog Box
2. Choose the Group to which you belong in the Group / (Select Group) drop down menu. Images are saved and retrieved based on the group you select.
3. Fill in the fields and click OK.
Another dialogue box appears, with a web address where you can view your image.
Dialog Box Showing Web Address of an Image
4. Copy and paste this address into your web browser to view your image. (Note that your address will be different from this example.)
5. When you are finished, click OK to close the dialog box.
Note To save a copy of your image to your own computer (for example, to have available even when you are not on the Internet), first view the image in a web browser, then right-click on a PC or control-click on a Mac and choose "Save Picture As…." Save the image with a name that you can remember. (Don't use the default "getimage.gif" name as you may over-write previously saved images.) If you would like to share your image in the Discussion Board, follow the directions under Technical Help, How to Share an Image from an Interactive.
Under the Graph Window is a slider bar and slider. (The slider resembles an inverted triangle.)
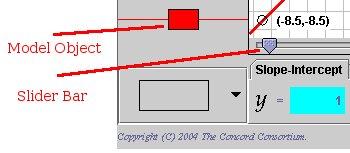
The Slider Bar, Slider, and Motion (or Model) Object
You may want to use a different icon from the usual rectangular model object. Click the icon selector to choose your new icon from the collection offered.
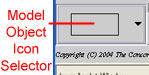
Model Object Icon Selector