Plop It!: User's Guide
Plop It! lets you experiment with the concepts
of mean, median, and mode (measures of center). You see the differences
among them on a bar graph, as you add or remove blocks to an axis with
a given range.
Click to open Plop It!
Note This Java applet requires a Java-capable browser. If you don't see the applet you may need to install or update Java.
Adding and Placing Blocks
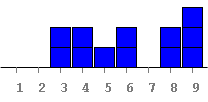
Click within the graph to add blue blocks. Click above the axis to place them exactly where you want.

- When
you adds blocks little pointers should appear which indicate the
respective piece of statistical information (mean, median, and mode).
Note how the pointers move as you add blocks. In what cases will you
get multiple pointers for mode?

- Click the radio buttons below the words When I click: to change whether blocks are added or removed.

Changing the Length of the x-axis or y-axis
Click the Increase Range or Decrease Range button to extend or shorten the length of the x-axis.

- You can change the interval of the range by altering the X-Range Starts At value and then clicking the Set button.

- Click Reset to reset the entire program (note that this clears the graph) .
Seeing the Statistical Information in Text
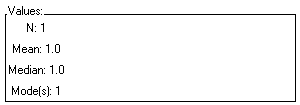
- Click the Show Stats button. The statistics panel (shown below) appears and the Show Stats button changes to read Hide Stats.
Click it to hide the statistics panel again.

Entering Data by Typing Text
Enter
data to be plotted by typing it in the text area (shown below). Each
number should be an integer and should be separated by a comma, a
space, or by pressing the enter key.
Type the data you want to use, and then click Update Graph to plot your data. Click Clear to clear all the data from the text area.


![]()

