The Quadratic Transformer was developed to support the learning of quadratic functions, and in particular to help you understand the connections between symbolic and graphic representations. Indirectly, it also helps you connect either of these representations to number patterns or physical situations.
The information presented here is designed to familiarize you with all the functionality of the Quadratic Transformer.
Changing a Function (using the graphic representation)
Changing a Function (using Polynomial, Vertex, or Root forms)
Changing Increments and Rounding Coefficients
Creating and Deleting Functions
Changing the Graph's Scale or Alignment
Making a Parabola Visible or Invisible
The illustration below shows the interface and names of the different areas.
Quadratic Transformer Areas
Each of these areas will be explained in this guide. To use this guide, it helps to have the Quadratic Transformer open. This will make the concepts clearer and allow you to experiment as we discuss each feature.
When the Quadratic Transformer opens, you see a quadratic function, as follows:
If you make changes to the parabola’s graphical form, the symbolic representation also changes. Likewise, if you change the symbolic expression, the graphical form changes.
An important part of learning about the relationship between the graphic and symbolic forms of quadratic functions is the ability to see how changes in one form affect another.
With the Quadratic Transformer, you can see changes in the graphic form of a function reflected simultaneously in the symbolic form.
Using the Drag-to-Transform Buttons, you can click and drag on any parabola to change its position, orientation (concavity), or shape—that is, to translate, reflect, and dilate it. (The symbolic form changes correspondingly.)
Drag-to-Transform Buttons (circled in red)
To change the graphic representation directly:
Note When the cursor is in the hand shape, clicking and dragging on the Graph Window will move the entire plane of the graph. This is useful if you wish to place the (0,0) coordinate in an off-center position in the window.
For precise control over the position of a parabola, and direct control of the coefficients, use the form selector tabs: Polynomial Form, Vertex Form, or Root Form. These let you view and change the coefficients directly.
Location of the Form Selector Tabs
To change the coefficients of a function:
Note You can choose the increments by which the coefficients change with the Step button, described in the next section.
Gain more precise control of the coefficients in the Polynomial, Vertex, and Root Forms by using two buttons—the Step: 0.1 button and the Round button.
Changing Increments Buttons
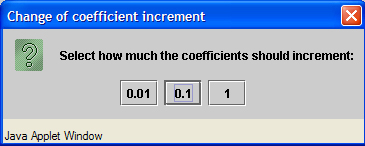
The coefficients can change in increments of hundredths, tenths, or
whole numbers, depending on the setting you choose. To change the
setting:
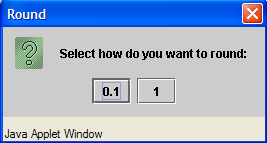
To round the numbers up to the tenth place or even to a whole number:
When you open the Quadratic Transformer, a single function appears, displayed as both a parabola and symbolic expression. You can add and delete functions to compare different parabolic forms and quadratic expressions.
To add or delete functions, use the buttons on the lower right-side of the interface:
Create and Delete Functions Buttons
Click New to create a new parabola and its symbolic expression (listed in the symbolic representation list). They will be in a different color from existing functions.
If you have not moved or transformed the original (red) parabola, you may only see your new parabola on the screen, because all parabolas created with the New button appear in the same location.
As long as you create new functions without moving or transforming previous ones, you will only see one parabola at a time. To see a parabola that is hidden under another, simply click its symbolic representation in the symbolic representation list. (This will also select that function for other operations.)
You can create a duplicate of an existing function. This allows you to create a new function that does not have to appear at the default location.
The duplicate parabola exactly covers the original. However, you can see the new function listed in the symbolic representation list.
To delete a particular function:
Click Delete to remove all functions (in both graphic and symbolic forms), including the original.
You can open a special dialog box to create a new parabola that is a translation, dilation or reflection of an existing parabola, using the Transform Function button:
The Transform Function feature helps you compare, in detail, a transformed parabola with its original. To use it:
In the lower part of the window, in the section labeled “Original function,” are tabs for the polynomial, vertex, and root forms. Click the tabs to select the form you wish to see.
Further down, under “Transformed function,” are three expressions representing aspects of the new function that you are about to create. (Initially, these are identical to the Original Function.) You see these transformed expressions in the same polynomial, vertex, or root form you chose under "Original function."
On the upper left side of the window are three available types of transformation: Translations, Dilations, or Reflections, with two forms available for each.
Translations allow you to move the vertex around the coordinate plane without changing the dilation or direction of the parabola. Select f(x+a) to move the vertex along the X axis and f(x)+a to move the vertex along the Y axis.
Dilations allow you to change the aperture or width of the parabola.
Reflections allow you to reflect the parabola over x or y axis.
Click a radio button to choose a transformation. The other choices now are grayed out. A few other things also happen:
You can manipulate the new parabola by dragging it in the plane, or by changing the number or sign in the square in the Transformed function area.
In the Transformed function area, you see, from top to bottom:
|
Example of the Transformed Function Area Displaying a Transformed Function |
When you finish working with a new parabola in the FunctionTransformation window, click one of three buttons:
The Trace Vertex button is located at the right side under the Change X Scale and Change Y Scale buttons.
The Trace Vertex Button
When you change a function (with one of the Drag-to-Transform tools or by changing the symbolic representation), this feature shows you a “trail” or a trace of a parabola’s vertex positions on the graph. The trace appears as a series of small dots or crosses.
If you drag the parabola, the trace dots will be closer together if you drag slowly; more spaced apart and less visible if you drag rapidly.
The Quadratic Transformer is a flexible tool that can change to accommodate the quadratic functions you wish to enter. The numbering of the x and y coordinates can be increased or decreased independently with the Change X Scale and Change Y Scale buttons.
To increase or decrease the scale of the X axis:
To increase or decrease the scale of Y axis:
Click the Reset Scale button to return to the standard (default) scale for both the X and Y axes.
When you roll your mouse over any empty area of the Graph Window (in any mode where the Window is white), the cursor appears as a hand image. If you click and drag the cursor when the hand is showing, you can drag the coordinate plane in any direction. This is handy if you wish to place the center of the plane (0,0) in an off-center position, or view parts of the parabola that are not easily seen unless the plane is moved to the side.
Be careful! If you move the plane to a point where you cannot see either the X axis or the Y axis, you may "lose" the center of your Graph Window or your entire parabola. Drag back toward the center, and they should reappear.
Beside each symbolic representation in the Symbolic Representation List is a visibility checkbox. Whenever you add a new function, the box appears checked and the function is visible.
To temporarily hide the graphical representation of a function, click its visibility checkbox. To make it reappear, click the checkbox again.
The Visibility Checkbox
Clicking on a visibility checkbox (whether to turn visibility on or off) automatically selects the corresponding function and parabola.
If a parabola is hidden "behind" another parabola in the Graph Window, clicking its visibility checkbox makes the hidden function appear (it will look as if the parabola changed color).
The screenshot button lets you save an image of your graph and its functions. To do this:
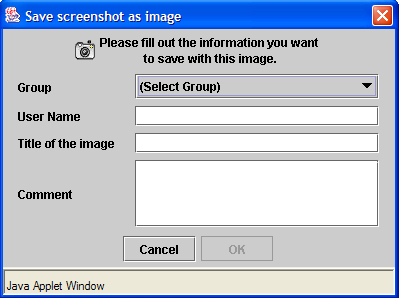
Note To save a copy of your image to your own computer (for example, to have available even when you are not on the Internet), first view the image in a web browser, then right-click on a PC or control-click on a Mac and choose "Save Picture As…." Save the image with a name that you can remember. (Don't use the default "getimage.gif" name as you may over-write previously saved images.)
Note If you are in a TeacherLine algebra course and would like to share your image in the Discussion Board, follow the directions in the course under Technical Help, How to Share an Image from an Interactive.
Under the Graph Window is a slider bar and the Slider Bar Button. (The button resembles an inverted triangle.)
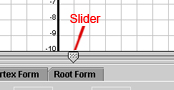
If you click and drag the slider left or right, a circle moves along each parabola in a position matching the x coordinate of the slider.
A small set of numbers accompanies the circle to display its x and y coordinates along the parabola.
The About button is located at the bottom of the screen next to the Screenshot button.
Clicking the About Button opens a dialog box that tells you the date and version number of the Quadratic Transformer interactive you are using. This can be helpful information to a support technician should you need technical assistance.