         |

Seeing Math™ Secondary: Dynamic Interactive Software Makes Math Come to Life
Seeing Math™ has developed interactive software tools to clarify key mathematical ideas in middle and high school mathematics. Each interactive provides a real-time connection between representations of the mathematics (symbolic, graphical, etc.), so that changes in one representation instantly cause changes in the other. The interactives are accessible here or through our Seeing Math Secondary courses to:
- Illustrate
and reinforce key mathematical ideas for teachers and students
of algebra.
- Accelerate
learning and enhance comprehension of difficult concepts.
- Allow users to save images of the interactive and share them with other participants.
Technical note: all interactives (except PlopIt!) were updated in December 2009 to work with Java 1.5 and higher. If you experience any problems using these, please email us at info@concord.org and try the earlier versions.
 User's Guide
FAQ
Warm-Up
Sample Activity (.pdf)
|
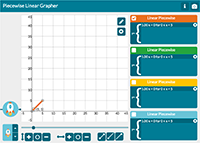
Piecewise Linear Grapher Highlight the language of domain and range, and the ideas of continuity and discontinuity, with this tool that links symbolic and graphic representations of each interval of a piecewise linear function.
 This new HTML5 version of the Piecewise Linear Grapher is browser-based and does not require Java to run. This new HTML5 version of the Piecewise Linear Grapher is browser-based and does not require Java to run.
|
|
Please note: The following archived interactives require a browser that supports Java applets. If you are unable to run them, view the user guides to see how each one clarifies key mathematical concepts.
|
Sample Activity (.pdf) |
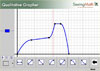
Qualitative Grapher Highlight the meaning of a function, and see how it can be seen as something changing over time, with this tool that links a motion model to a graph.
|
User's Guide
FAQ
Warm-Up
Sample Activity (.pdf)
|
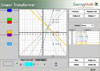
Linear Transformer
Highlight the meaning of each component of a linear function's symbolic expression with this tool that links symbolic and graphic representations of translating (dragging) a line vertically or horizontally, rotating it around a fixed point, or reflecting it around the x- or y-axis.
|
User's Guide
Warm-Up
Sample Activity (.pdf)
|
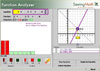
Function Analyzer Highlight the rationale behind symbolic operations used to solve a linear equation with this tool that displays changes in the graphic and area models of functions as you change the value of each symbolic element.
|
User's Guide
FAQ
Warm-Up
Sample Activity (.pdf)
|
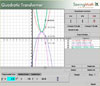
Quadratic Transformer Highlight the meaning of each component of a quadratic function's symbolic expression with this tool that links symbolic and graphic representations of translating (dragging) a parabola vertically or horizontally, dilating it, or reflecting it around the x- or y-axis.
|
 User's Guide
FAQ
Warm-Up
Sample Activity (.pdf)
|
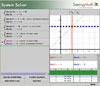
System Solver
Highlight how symbolic operations on a system of linear equations do (or do not) change the graphic or tabular representations of the system.
Note that the System Solver is a tool intended to illustrate the rationale behind the symbolic operations used to solve systems of linear equations, and not a way to learn what procedures to follow. |
User's Guide
Warm-Up
Sample Activity (.pdf)
|
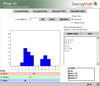
Plop It!
Highlight how changing a data set affects the mean, median, and mode with this tool (created by The Shodor Education Foundation and modified by The Concord Consortium) that allows you to add and delete data graphically. |
User's Guide
Warm-Up
Sample Activity(.pdf)
|
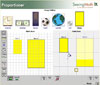
Proportioner Highlight proportion and scale with this tool that allows you to compare image dimensions by using one image to "paint" another.
|
Download All Interactives for Offline Use
|
|

| Java
Note
You need Java 1.5 or higher to run these
interactives.
Visit http://www.java.com to download the latest version of Java.
|
Saved Images
Participants in Seeing Math™ Secondary courses can save, browse, and retrieve images created when using the interactives.
|
| Free for Public Use
All of the Seeing Math™ Secondary interactives are free for you to use.
Most are copyrighted by The Concord Consortium and licensed to you under the GNU Lesser General Public License (LGPL). For more information, see our software license and copyright.
The Plop It! interactive was created by the Shodor Foundation with revisions by the Seeing Math project and is free to use. For further information contact the Shodor Foundation.
|

|
|